
The site is read-only. Please transition to use Robotics Stack Exchange
| ROS Resources: Documentation | Support | Discussion Forum | Index | Service Status | ros @ Robotics Stack Exchange |
| | 1 | initial version |
You will be happy to know that I fixed my problem with gmapping and LPLidar. You can find a full documentation about the fix here (including source code modification of course): I hope can be useful for you too!
| | 2 | No.2 Revision |
You will be happy to know that I fixed my problem with gmapping and LPLidar. You can find a full documentation about the fix here (including source code modification of course): I hope can be useful for you too!
GMapping use two parameters to define laser beam range:
(Description taken by ros gmapping wiki)
The long lines you see on your map are created when the laser measured range is between maxUrange and maxRange. You can try to set maxUrange = maxRange. By the way I think the real problem is another: why your laser measures this range if there is a wall?
Can you take a picture of RViz where laser scan data is shown too? I suggest to set decay to 120 secs so we can see more data. I want to check if long lines are really generated by laser measures of if they are artefacts of GMapping.
| | 3 | No.3 Revision |
You will be happy to know that I fixed my problem with gmapping and LPLidar. You can find a full documentation about the fix here (including source code modification of course): I hope can be useful for you too!
GMapping use two parameters to define laser beam range:
(Description taken by ros gmapping wiki)
The long lines you see on your map are created when the laser measured range is between maxUrange and maxRange. You can try to set maxUrange = maxRange. By the way I think the real problem is another: why your laser measures this range if there is a wall?
Can you take a picture of RViz where laser scan data is shown too? I suggest to set decay to 120 secs so we can see more data. I want to check if long lines are really generated by laser measures of if they are artefacts of GMapping.
Can you register and upload a bag file of your test? Remember to move the robot in your environment recording data in order to have an idea of the expected map. You should record tf and your laser scan topic.
Further question: on the posted RViz screenshot I can see an entry referring AMCL, are you running it too?
| | 4 | No.4 Revision |
You will be happy to know that I fixed my problem with gmapping and LPLidar. You can find a full documentation about the fix here (including source code modification of course): I hope can be useful for you too!
GMapping use two parameters to define laser beam range:
(Description taken by ros gmapping wiki)
The long lines you see on your map are created when the laser measured range is between maxUrange and maxRange. You can try to set maxUrange = maxRange. By the way I think the real problem is another: why your laser measures this range if there is a wall?
Can you take a picture of RViz where laser scan data is shown too? I suggest to set decay to 120 secs so we can see more data. I want to check if long lines are really generated by laser measures of if they are artefacts of GMapping.
Can you register and upload a bag file of your test? Remember to move the robot in your environment recording data in order to have an idea of the expected map. You should record tf and your laser scan topic.
Further question: on the posted RViz screenshot I can see an entry referring AMCL, are you running it too?
I run some test on your bag data. This the result of odometry test:
Since you are working in large environment (I measured abut 5 meters square room) you can be happy about it! Any way I suggest you to follow this guide (if you already didn't): it will help you not only to improve your robot performances but you can also learn something about navigation stack in ROS.
BTW I ran GMapping with the parameters I suggested and, actually, I reproduced the same problem you claim about (sorry, my environment is not so large so I never experienced it!). Fortunately the solution is easy. Set following parameters:
odom_frame: odom
delta: 0.025
minimumScore: 50
maxRange: 5.5
maxUrange: 5.5
linearUpdate: 0.2
angularUpdate: 0.25
temporalUpdate: 5
I got this result:
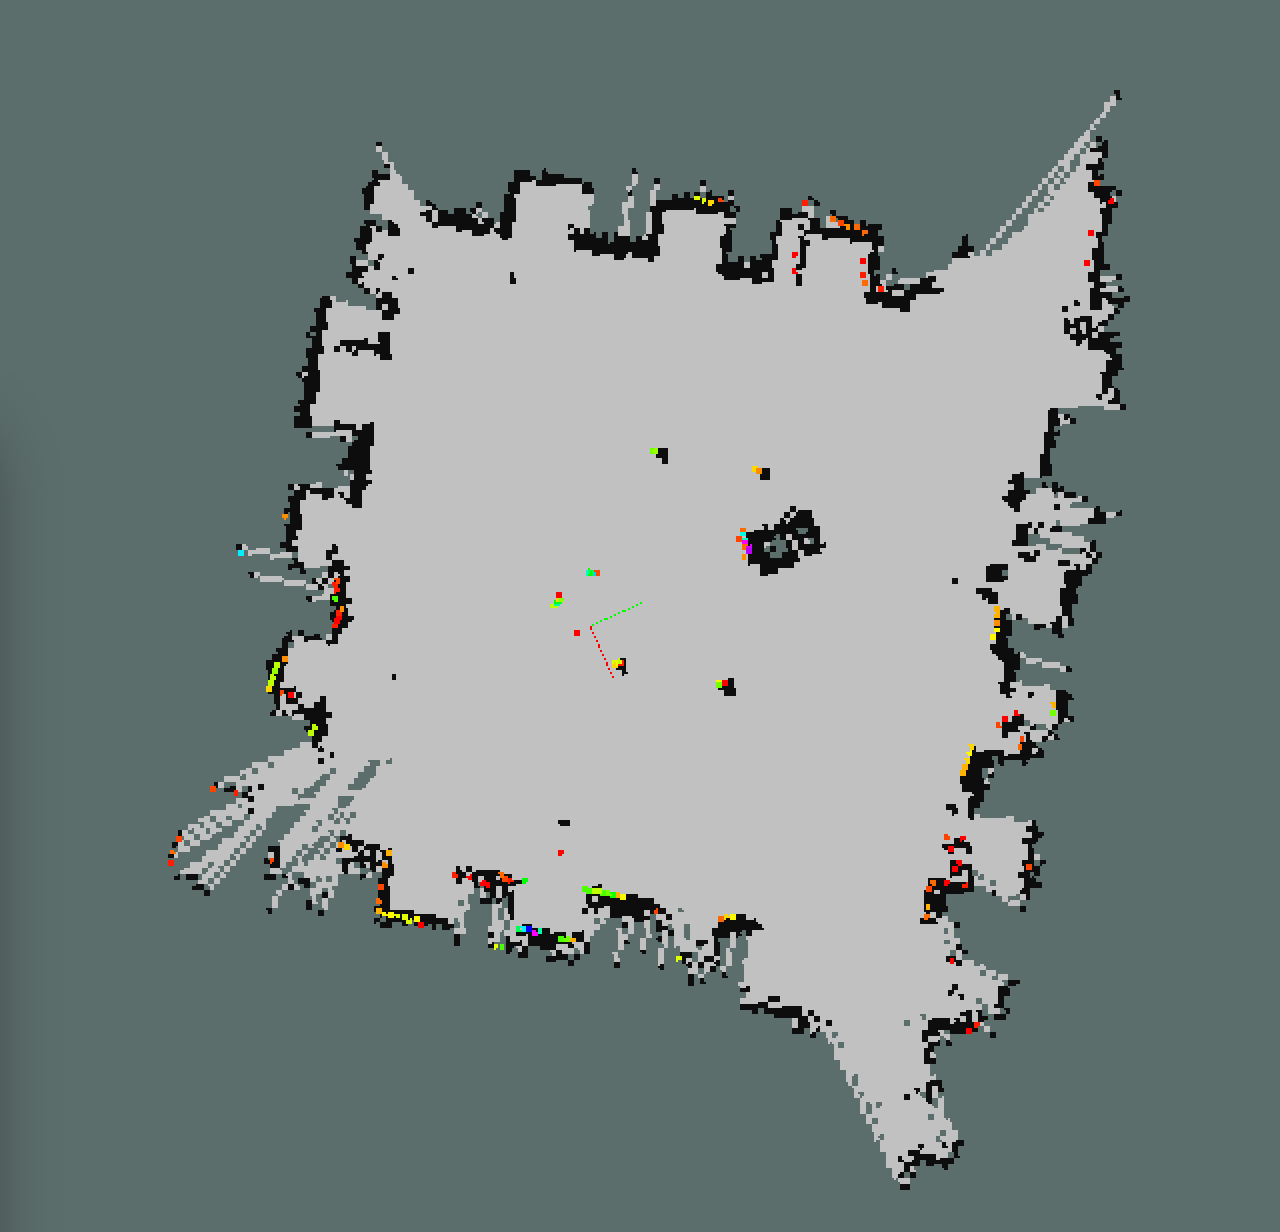
Maybe it is not perfect but:
I hope this will fix your problem!!
 ROS Answers is licensed under Creative Commons Attribution 3.0 Content on this site is licensed under a Creative Commons Attribution Share Alike 3.0 license.