Problems in visualizing sequential points as connected line segments
Hi, I am trying to visualize sequential points as connected line segments using Rviz in ROS Indigo Ubuntu 14.04 LTS PC. Below is the snippet of data, received using rostopic echo command on terminal:
jointPositions:
  -
    trackingState: True
    position:
      x: -0.435596
      y: -0.142820448
      z: 1.82237065
    jointType: 0
  -
    trackingState: True
    position:
      x: -0.4052974
      y: 0.13666603
      z: 1.73648691
    jointType: 1
  -
    trackingState: True
    position:
      x: -0.3760757
      y: 0.345686644
      z: 1.65679443
    jointType: 20
  -
    trackingState: True
    position:
      x: -0.36667335
      y: 0.4120549
      z: 1.62908721
    jointType: 2
  -
    trackingState: True
    position:
      x: -0.324401945
      y: 0.485795557
      z: 1.58831823
    jointType: 3
  -
    trackingState: True
    position:
      x: -0.5145141
      y: 0.284414381
      z: 1.65062976
    jointType: 4
  -
    trackingState: True
    position:
      x: -0.612595141
      y: 0.4024704
      z: 1.55085456
    jointType: 5
  -
    trackingState: True
    position:
      x: -0.6313961
      y: 0.549976766
      z: 1.4715327
    jointType: 6
  -
    trackingState: True
    position:
      x: -0.6528342
      y: 0.620140254
      z: 1.448911
    jointType: 7
  -
    trackingState: True
    position:
      x: -0.265343577
      y: 0.278526247
      z: 1.75809133
    jointType: 8
  -
    trackingState: True
    position:
      x: -0.123725727
      y: 0.2178925
      z: 1.6266855
    jointType: 9
  -
    trackingState: True
    position:
      x: -0.007252288
      y: 0.183696628
      z: 1.43388867
    jointType: 10
  -
    trackingState: True
    position:
      x: 0.105958693
      y: 0.157047316
      z: 1.27662742
    jointType: 11
  -
    trackingState: True
    position:
      x: -0.487728119
      y: -0.1287106
      z: 1.77689838
    jointType: 12
  -
    trackingState: True
    position:
      x: -0.433793515
      y: -0.344230652
      z: 1.39414346
    jointType: 13
  -
    trackingState: True
    position:
      x: -0.4238537
      y: -0.59930253
      z: 1.2503947
    jointType: 14
  -
    trackingState: True
    position:
      x: -0.378920853
      y: -0.645869136
      z: 1.1385659
    jointType: 15
  -
    trackingState: True
    position:
      x: -0.367541432
      y: -0.151269555
      z: 1.80178738
    jointType: 16
  -
    trackingState: True
    position:
      x: -0.205929413
      y: -0.399689019
      z: 1.45195925
    jointType: 17
  -
    trackingState: True
    position:
      x: -0.194217354
      y: -0.525068
      z: 1.39156806
    jointType: 18
  -
    trackingState: True
    position:
      x: -0.1547204
      y: -0.5737468
      z: 1.27755761
    jointType: 19
  -
    trackingState: True
    position:
      x: -0.682371557
      y: 0.688038
      z: 1.41724646
    jointType: 21
  -
    trackingState: True
    position:
      x: -0.681404054
      y: 0.5892486
      z: 1.45565391
    jointType: 22
  -
    trackingState: True
    position:
      x: 0.1445924
      y: 0.141057357
      z: 1.18761849
    jointType: 23
  -
    trackingState: True
    position:
      x: 0.09335878
      y: 0.201266348
      z: 1.25917614
    jointType: 24
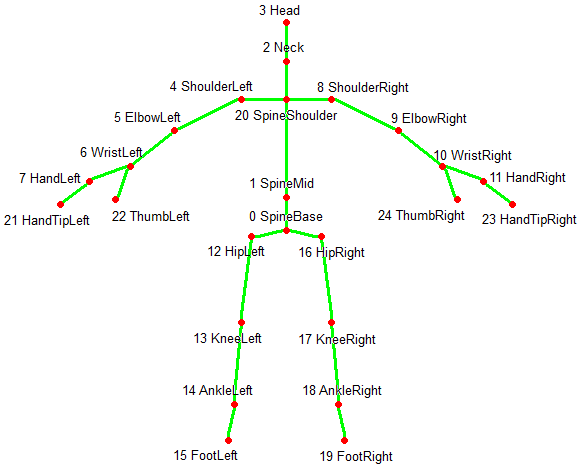
The above data is received from Kinect and represents joints in the human skeleton, in which each joint has unique jointType field. Below is the more information about joint type as defined in Kinect v2 sensor:

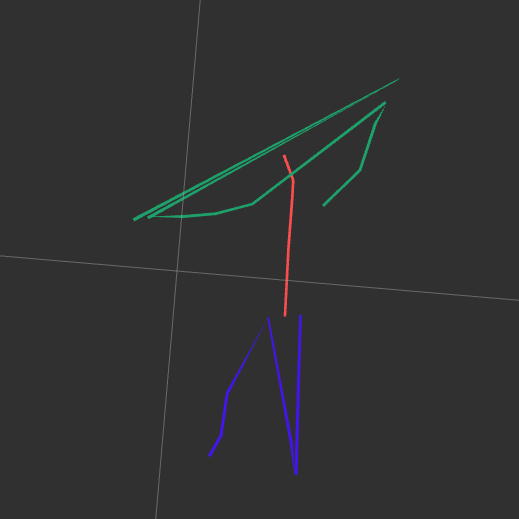
I want to visualize this skeleton by showing it as connected line segments in Rviz. However, the displayed skeleton looks weird as below:

Here, the skeleton is considered as a combination of line strips, which is set of lines. Hence, I decomposed the skeleton into three LINE_STRIP as following:
upper_body# [In Red Color] from head to spine basehands# [In Green Color] from left-hand tip to right-hand tiplegs# [In Blue Color] from left foot to right foot ...


