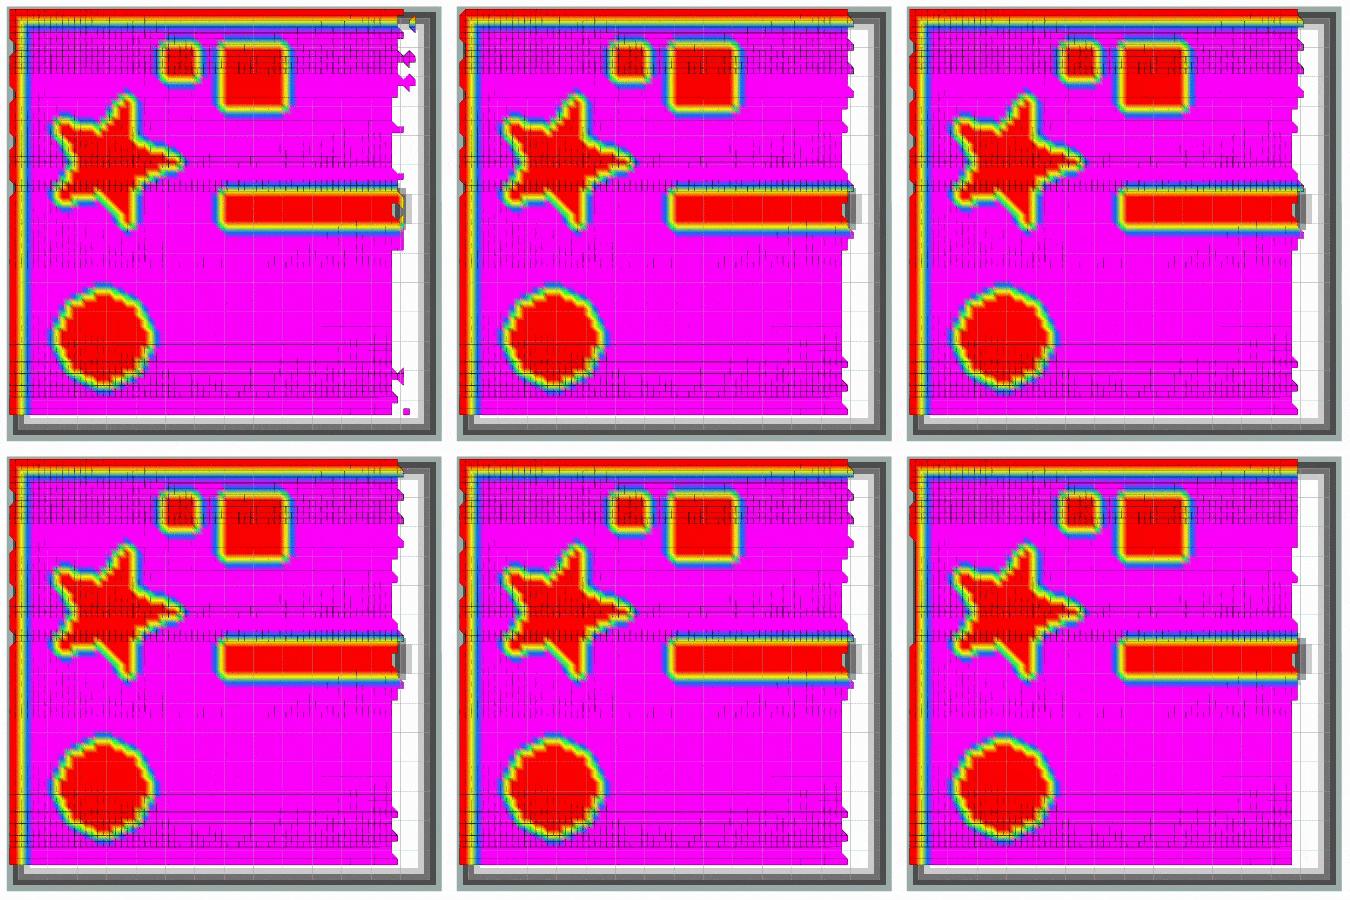
Incomplete grid_map surface plots in Rviz using grid_map_msgs/GridMap messages
Hi all,
I want to convert nav_msgs/OccupancyGrid messages to messages of type grid_map_msgs/GridMap using Python.
I have searched ROS Answers about my issue, without success.
The conversion itself seems to be working fine. However, the 3d surface plots (height maps) in RViz look incomplete.
Parts of the surface plots are not shown, there are missing triangles that create holes in the 3d surface.
As the image below illustrates, this affects both rows and columns (GridMap should be the same size as the OccupancyGrid below). Also some bits appear and disappear:

What I have tried so far:
- change the publishing rate (2 and 1 hz)
- change the publishers queue_size (to 1 and 5)
I am using the following code:
import rospy
from grid_map_msgs.msg import GridMap
from std_msgs.msg import Float32MultiArray, MultiArrayLayout, MultiArrayDimension
from nav_msgs.msg import OccupancyGrid
import numpy as np

def global_costmap_callback(data):
  global costmap, costmap_height, costmap_width
  costmap_height = data.info.height
  costmap_width = data.info.width
  costmap_binary = [100 if x ==-1 else x for x in data.data]
  costmap_np = np.asarray(costmap_binary, dtype=np.float64).reshape(data.info.height, data.info.width)
  costmap_np *= (1.0/costmap_np.max())
  costmap = np.rot90(costmap_np, 2).flatten().tolist()

if __name__ == '__main__':
  rospy.init_node('grid_map_test', log_level=rospy.INFO, anonymous=False)
  rospy.Subscriber("move_base/global_costmap/costmap", OccupancyGrid, global_costmap_callback)
  map_pub = rospy.Publisher("grid", GridMap, queue_size=5)

  gridmap = GridMap()
  multi_array = Float32MultiArray()
  costmap = []
  costmap_height = 0
  costmap_width = 0

  while (len(costmap) < 1 ):
     pass

  multi_array.layout.dim.append(MultiArrayDimension())
  multi_array.layout.dim.append(MultiArrayDimension())
  multi_array.layout.dim[0].label = "column_index"
  multi_array.layout.dim[0].size = costmap_width
  multi_array.layout.dim[0].stride = costmap_width * costmap_width
  multi_array.layout.dim[1].label = "row_index"
  multi_array.layout.dim[1].size = costmap_height
  multi_array.layout.dim[1].stride = costmap_height
  dstride0 = multi_array.layout.dim[0].stride
  dstride1 = multi_array.layout.dim[1].stride
  multi_array.data = costmap
  gridmap.layers.append("elevation")
  gridmap.data.append(multi_array)
  gridmap.info.length_x = 14
  gridmap.info.length_y = 14
  gridmap.info.pose.position.x = 0.4
  gridmap.info.pose.position.y = 0.4
  gridmap.info.header.frame_id = "map"
  gridmap.info.resolution = 0.2

  while not rospy.core.is_shutdown():
    rospy.rostime.wallsleep(2.0)
    map_pub.publish(gridmap)

