Costmap converter visualization - teb_local_planner
Hi,
I am using the teb_local_planner for my ackermann robot at the moment. After noticing that my performane is pretty bad (like 1Hz of control update) I wanted to try the costmap converter plugin with the planner. As someone mentioned without the converter the obstacles in the costmap are treated as a single point which leads to a huge amount of distance calculation.
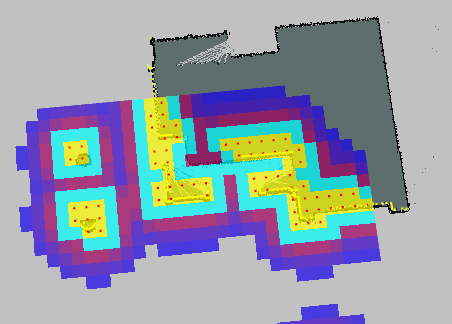
The problem I have is, I don't know how to visualize the output of the costmap_converter plugin.
I followed this tutorial and when running my robot specific move_base launch file it says it loaded the plugin for example like here in the output of the launch file:
[ INFO] [1462963729.309633367, 443.699000000]: Costmap conversion plugin costmap_converter::CostmapToPolygonsDBSConcaveHull loaded.
How do I visualize the created conversions like polygons as seen in the package description of the costmap_converter plugin here?
EDIT
#1
After adding Marker Display type in Rviz this was the output:

The loaded converter was following with following parameters:
[ INFO] [1463730376.455696206, 722.323000000]: Costmap conversion plugin costmap_converter::CostmapToPolygonsDBSMCCH loaded.
the used .yaml file and launch file:
costmap_converter_params.yaml
TebLocalPlannerROS:
 costmap_converter_plugin: "costmap_converter::CostmapToPolygonsDBSMCCH"
 costmap_converter_spin_thread: True
 costmap_converter_rate: 5
 costmap_converter/CostmapToPolygonsDBSMCCH:
    cluster_max_distance: 0.4
    cluster_min_pts: 2
    cluster_max_pts: 30
    convex_hull_min_pt_separation: 0.1
move_base.launch
<?xml version="1.0"?>
<launch>
    <master auto="start"/>
    <arg name="map_file" default="$(find my_maps)/random_test.yaml"/>
    <!--<arg name="map_file" default="$(find my_maps)/first_map6.yaml"/>-->
    <!-- Run the map server -->
    <node name="map_server" pkg="map_server" type="map_server" args="$(arg map_file)"/>

    <!--- Run AMCL -->
    <!--- We load ACML here with diff=true to support our differential drive robot -->
    <include file="$(find robot_2d_nav)/launch/amcl_example.launch" />

    <node pkg="move_base" type="move_base" respawn="false" name="move_base" output="screen" clear_params="true">
        <rosparam file="$(find robot_2d_nav)/costmap_common_params.yaml" command="load" ns="global_costmap" />
        <rosparam file="$(find robot_2d_nav)/costmap_common_params.yaml" command="load" ns="local_costmap" />
        <rosparam file="$(find robot_2d_nav)/local_costmap_params.yaml" command="load" />
        <rosparam file="$(find robot_2d_nav)/global_costmap_params.yaml" command="load" />
        <rosparam file="$(find robot_2d_nav)/base_local_planner_params.yaml" command="load" />

        <param name="base_local_planner" value="teb_local_planner/TebLocalPlannerROS"/>
        <param name="base_global_planer" value="global_planner/GlobalPlanner"/>
        <param name="controller_frequency" value="10.0" />

        <!-- LOAD COSTMAP_CONVERTER PARAMETERS HERE -->
        <rosparam file="$(find robot_2d_nav)/costmap_converter_params.yaml" command="load" />
    </node>

    <node pkg="teb_local_planner" type="cmd_vel_to_ackermann_drive.py" name="cmd_vel_to_ackermann">
        <param name="wheelbase" value="1.811" />
    </node>
</launch>
#2
Hi Christoph, I will change the resolution on monday and try it again, the current resolution is 0.5 so you say i should go to 0.1 or something in this area? Or should i change cluster_max_distance?
local_costmap_params.yaml
local_costmap:
  global_frame: map
  robot_base_frame: base_footprint
  publish_voxel_map: true
  update_frequency: 5.0
  publish_frequency: 2.0
  static_map: false
  rolling_window: true
  width: 10.0
  height: 10.0
  resolution: 0.5
If I have enough spare time I will push everything to my personal git and give you access to it also on Monday, so you can check the simulation (see below) and the planner and converter.
The specs are following: Laptop #1 (Just for gazebo simulation)
- i7-4712MQ
- 16GB RAM
- Nvidia 860GTX
- 512GB SSD
Laptop #2 (running the planner and converter)
- i5-5300U
- 8GB RAM
- Onboard ...

