ROS Resources: Documentation | Support | Discussion Forum | Index | Service Status | ros @ Robotics Stack Exchange
Ask Your Question
2

how to use rxplot to plot data on /tf

asked 2013-03-20 20:06:25 -0600

sai gravatar image

ubuntu 12.04 and fuerte

How to use rxplot to plot the transforms? They have the position and orientation.

Example

header: seq: 0 stamp: secs: 1311867210 nsecs: 774027961 frame_id: /world child_frame_id: /kinect transform: translation: x: 0.208460861206 y: -1.06889804077 z: 1.87455181885 rotation: x: -0.0425775370706 y: -0.0287192089576 z: 0.77849649613 w: 0.625544215773

edit retag flag offensive close merge delete

3 Answers

Sort by » oldest newest most voted
3

answered 2013-03-20 23:20:40 -0600

Miquel Massot gravatar image

updated 2013-03-20 23:21:16 -0600

In my opinion, rxplot is not the best tool at plotting tf's. I would recommend you to use rviz for that.

If you want to see x, y and z positions and orientations maybe you should consider using an odometry or pose topic parsed from the node tf or something similar, in order to avoid what Adolfo Rodríguez comments.

edit flag offensive delete link more

Comments

1

There is no "best tool", as the goodness measure depends a lot on your requirements. Rviz excels at visualizing instantaneous frame configurations, but if you're interested in visualizing time series a plotting tool might be more appropriate.

Adolfo Rodriguez T gravatar image Adolfo Rodriguez T  ( 2013-04-03 21:48:36 -0600 )edit
1

...additionally the details of a specific implementation can make your life easier or harder. Plotting a /tf time series with rxplot/rqt has its difficulties, but plotting a pose_stamped topic is straightforward. YMMV...

Adolfo Rodriguez T gravatar image Adolfo Rodriguez T  ( 2013-04-03 21:53:09 -0600 )edit
2

answered 2013-03-20 22:38:00 -0600

Adolfo Rodriguez T gravatar image

The following snippet will print the x coordinate of the first transform in a tf message:

rxplot /tf/transforms[0]/transform/translation/x

Big caveat: if there are multiple publishers of the /tf topic, this won't work, as the transform vector index (the [0] above) will not always represent the same frame. Further, f you're querying a nonzero index, it might be possible that the index does not even exist in a given message.

I would recommend republishing the transform(s) of interest as a separate pose(stamped) message and plot from there. More overhead, but less surprises.

edit flag offensive delete link more
0

answered 2021-06-19 03:09:09 -0600

Kei Okada gravatar image

I ran into same question and what we found so far...

For example, we have transformation between world, earth, moon, and we want to plot time-series data of transform between world and moon
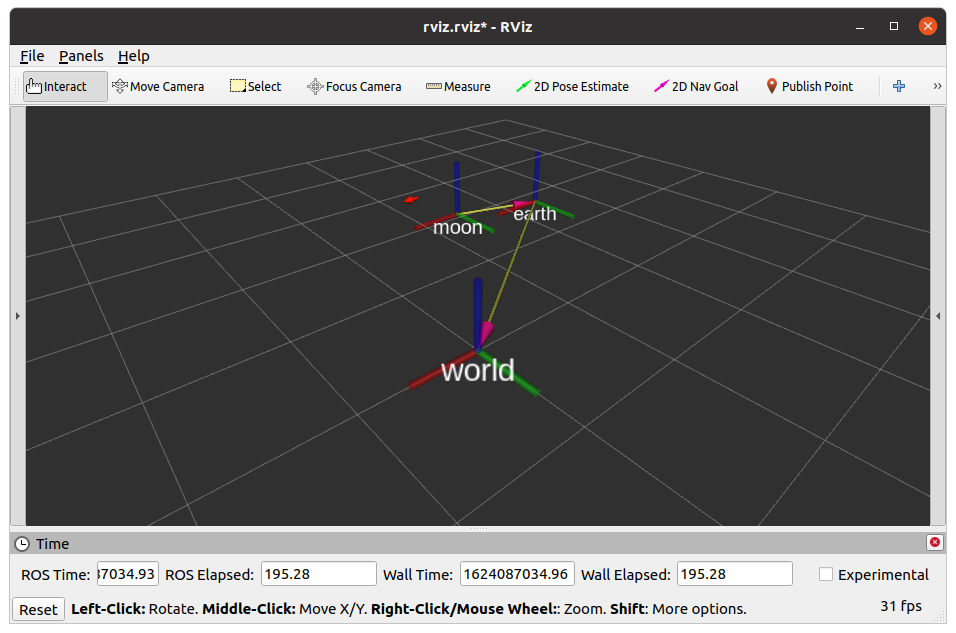
Example

1) Convert world <- moon TF transform to PoseStamped (and others) and plot using rqt_plot

tf_to_pose.py convert arbitrary transform to geometry_msgs/PoseStamped message, which is easy to plot by rqt_plot tool
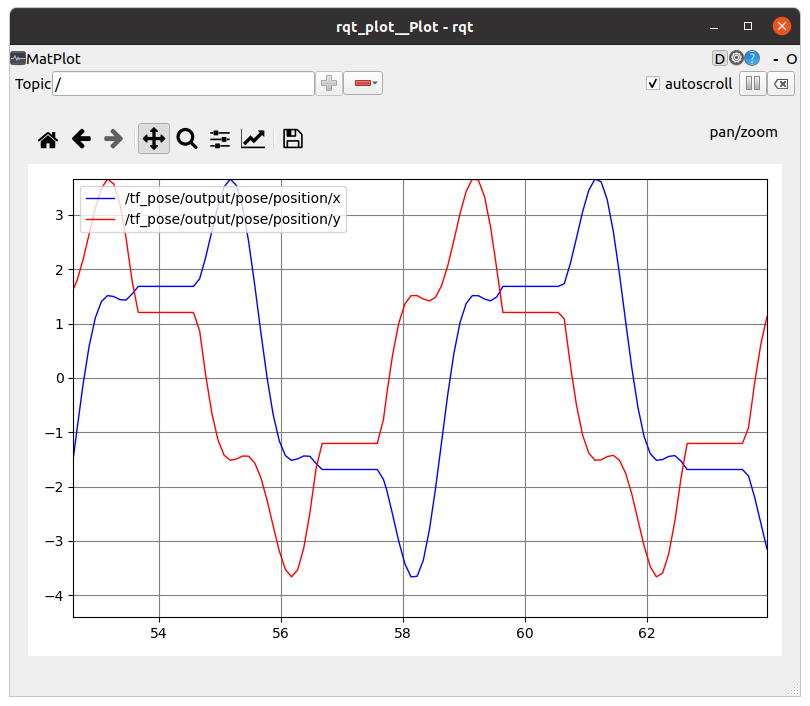
rqt_plot

2) Rebroadcast world <- moon TF transforms with different name, ad world <- moon2, then plot with plotjuggler

plotjuggler capable of plot tf transform ONLY between child frame and parent frame. So if we can rebroadcast tf transforms with different frame id on the fly

plotjuggler

3) use rviz plugins

duplicated questions in answers.ros.org suggested few useful links, for example tf_trajectory shows
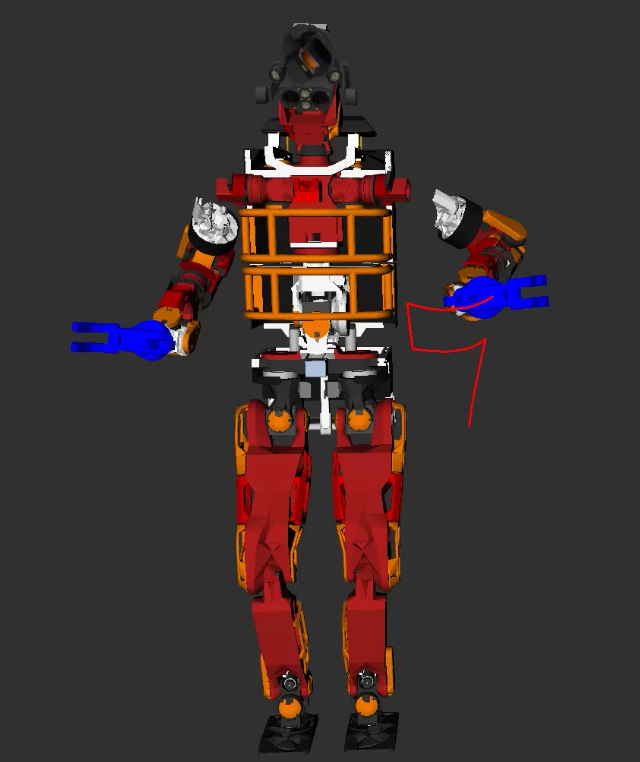
image description

4) use hector_trajectory_server

duplicated questions in answers.ros.org also suggested to use hector_trajectory_server, you can visualize as Path on rviz, but I personally do not know how to plot on rqt and other tools.
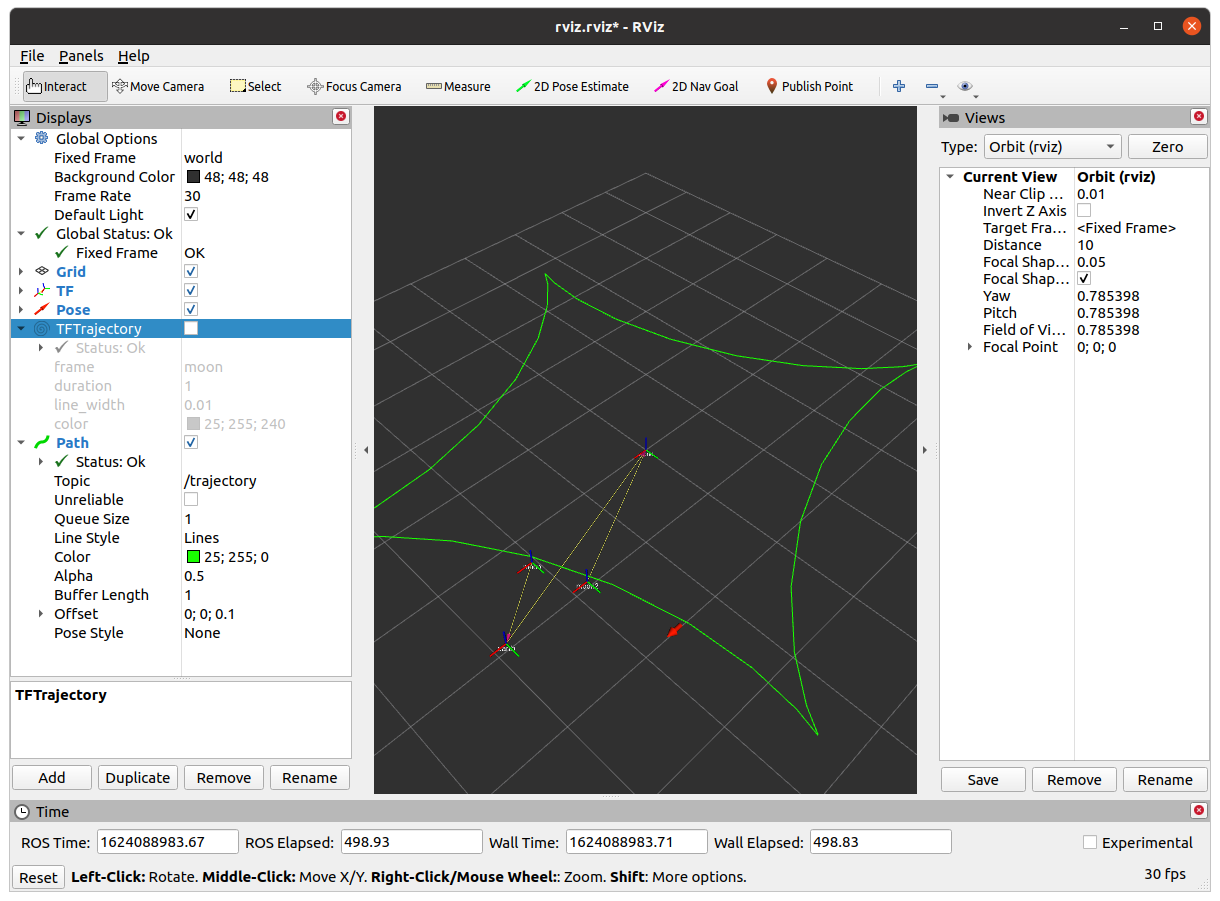
hector_trajectory_server

You can find example code at https://gist.github.com/k-okada/8d4f6...

edit flag offensive delete link more

Question Tools

1 follower

Stats

Asked: 2013-03-20 20:06:25 -0600

Seen: 2,798 times

Last updated: Jun 19 '21